Environmental Impact of Sulfuric Acid Leaching
The electro-winning system [SX-EW] of extracting copper is a step in the right direction as the mining industry attempts to develop methods that have less of an impact on the environment. Really, it's a huge step since it eliminates tailings impoundments, which are unsightly and can cause water pollution, and smelting, which can cause soil and air pollution. Howver, SX-EW only works on oxide ore, whereas the majority of the ore at Rosemont is sulfide and will not dissolve into solution in a reasonable period of time. Therefore, leaching can be used on some 14% of the ore, or approximately 59 million tons over some 15 years.
Sulfuric acid, the leaching agent, is brought on site in large tankers. The sulfuric acid is diluted and sprayed or dripped over oxide ore, which dissolves the oxidized minerals completely in the solution. The solution, “pregnant” with the dissolved metals, is then piped to the SX-EW plant. The waste solution is piped to on-site holding ponds, which are securely lined, awaiting the next load of oxide ore to be placed on the leach pads.
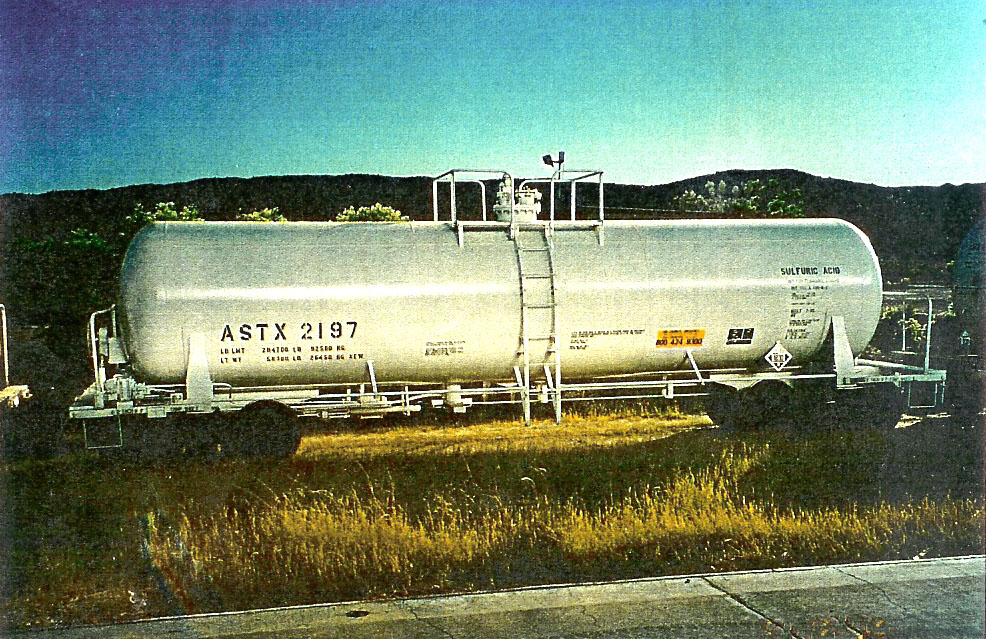
Sulfuric Acid Tanker on mining site
Pads for Leaching Ore with Sulfuric Acid Solution
Ideally, this system is a closed circuit and is considered environmentally safe. However, there are two conduits to environmental impact. First, the leach solution is stored in open ponds (until the mine is closed then it is put in barrels and taken to toxic waste dumps). Second, spills of the sulfuric acid and the leach solution, which is laden with heavy metals, including radionuclides that are present with metals in Arizona, can spill as they are piped around the facility.
1) Toxic Ponds: As the leach solution is reused, the unwanted metals concentrate into a very toxic solution, which sits out in open ponds, waiting to be piped back to be sprayed or dripped onto fresh ore on the leach pads.
These ponds are not appropriate for a natural setting where birds and animals should have some priority. Are the open ponds a danger to animals and birds? In general, it appears that they are not, for it the critters seem to have an instinct about such toxic places. However, this does not mean that an errant bird, lizard, frog or snake could not happen by and fall in. Any evidence would be dissolved in a split second.
Holding Ponds for Leaching Solution for Leach Pads (on far right)
Close-up of Holding Pond with Leach Solution
The data on the table below shows the "Characteristics of Leach Solution, which is classifed as hazardous waste. Whereas these ponds are an inevitable part of mining and are considered to be an improvement over tailings impoundments and smelting, it is questionable if they are appropriate for a National Forest setting with its requirements for beneficial use.
Facility/Sample Location |
Bailey Lake |
B-Pond (D-07) |
Duval Canal (D-29) |
SX-3 Drain Pond |
SX-1 Drain Pond |
SX-1 Tank Farm Pond (D-34) |
Reclaim Pond |
D Pond (D-45) |
|
Date Sampled |
4/22/98 |
4/22/98 |
9/15/98 |
4/15/99 |
4/15/99 |
4/15/99 |
4/15/99 |
6/30/98 |
|
Conductance (umhos/cm) |
16,300 |
8,270 |
2,425 |
629 |
104,000 |
3450 |
2540 |
||
pH, field (su.) |
2 |
2.88 |
7.34 |
10.49 |
|||||
pH, lab (su.) |
2.1 |
3 |
6.9 |
1.8 |
7 |
1.4 |
10.4 |
6.3 |
|
Total Dissolved Solids (mg/ltr) |
47,500 |
15,900 |
2140 |
3870 |
629 |
37,000 |
3270 |
2270 |
|
Sulfate (mg/ltr) |
23,000 |
9280 |
1220 |
3310 |
190 |
35,600 |
1820 |
1240 |
|
Arsenic (mg/ltr) |
0.15 |
0.13 |
ND |
0.03 |
0.06 |
ND |
0.052 |
0.049 |
|
Calcium (mg/ltr) |
522 |
667 |
541 |
125 |
68.3 |
141 |
645 |
432 |
|
Magnesium (mg/ltr) |
3680 |
1380 |
82.9 |
95.1 |
9 |
176 |
0.5 |
32.4 |
|
Sodium (mg/ltr) |
405 |
383 |
144 |
98.4 |
60.9 |
147 |
276 |
53.1 |
|
Potassium (mg/ltr) |
65 |
11 |
38.9 |
19.2 |
490 |
59.3 |
19.2 |
||
Chloride (mg/ltr) |
3540 |
2050 |
92 |
140 |
16 |
620 |
320 |
170 |
|
Fluoride (mg/ltr) |
260 |
78 |
1.4 |
6 |
0.9 |
240 |
1.3 |
1.5 |
|
Nitrate (mg/ltr) |
6.8 |
0.03 |
1.58 |
2.38 |
3.6 |
2.23 |
0.33 |
||
Beryllium (mg/ltr) |
1.06 |
0.312 |
0.01 |
0.0008 |
0.0008 |
0.03 |
ND |
ND |
|
Cadmium (mg/ltr) |
1.17 |
0.522 |
0.015 |
0.0181 |
0.0022 |
0.0392 |
0.014 |
0.046 |
|
Chromium (mg/ltr) |
1.1 |
0.1 |
ND |
0.36 |
ND |
ND |
ND |
ND |
|
Cobalt (mg/ltr) |
10.7 |
3.6 |
0.06 |
0.21 |
ND |
15.3 |
ND |
ND |
|
Copper (mg/ltr) |
3.2 |
845 |
55.3 |
5700 |
0.51 |
||||
Iron (mg/ltr) |
710 |
282 |
49.9 |
49.5 |
2.72 |
342 |
ND |
0.23 |
|
Lead (mg/ltr) |
0.023 |
0.015 |
0.136 |
0.0627 |
0.041 |
0.298 |
ND |
0.002 |
|
Manganese (mg/ltr) |
501 |
227 |
6.65 |
9.27 |
0.35 |
23.1 |
ND |
2.53 |
|
Molybdenum( mg/ltr) |
1 |
>0.5 |
0.6 |
0.26 |
0.07 |
2 |
3.71 |
11.3 |
|
2) Spills of solution and acid: The solution is transferred to and from the leach solution ponds to the leach pads using pipelines. This presents a danger of leaks and spills due to breaking of the pipes. This happens regularly, including Sierrita, although that they use every measure possible to avoid such "incidents." Further, it is possible for the equipment to fail and a pond to overflow as happened in Silver Bell Operations, 2002. Whereas the milling areas and ponds are on private land in these two cases, at Rosemont the mill will be on public land.
As called out in the Rosemont Plan, Augusta is well aware of the problem of "accidents" and "incidents," which they cannot and do not guarantee will not occur.
Augusta plans to manage hazardous, or potentially hazardous, substances by managing the source. All products will be reviewed prior to purchase and an approval process put into place so that the relative hazard of the material is weighed equally with disposal considerations, cost, and effectiveness. Once a material is approved for use on site, the employees will be instructed in the hazards, both to human health and the environment, as part of the MSHA Hazard Communication (HazComm) Program. Proper handling and disposal techniques can be developed prior to use. This will help conserve resources and eliminate the unnecessary generation of hazardous and other wastes.
By managing the materials before they are purchased, and by giving the employees the proper information regarding storage, handling, and disposal, accidents or incidents associated with hazardous substances will be minimized, if not eliminated. [Page 30, Rosemont Plan]
Summary of Spills at Sierrita Copper mine, Pima County, Arizona
—All spills were on-site in mill area
9/06/05 8,058 lbs. Sulfuric Acid (Report)
9/24/05 1,000 lbs. Sulfuric Acid (Report)
2/5/02 39,375 gals. Sulfuric Acid
7/3/01 1,209 lbs. Sulfuric Acid
5/22/00 5,350 gals. Leach Solution (Sulfuric acid/Copper)
5/05/98 40,000 gals. Leach Solution (Sulfuric acid/Copper)
5/04/98 120,000 gals. Leach Solution (Sulfuric acid/Copper)
3/29/97 8,000 lbs. Sulfuric acid-93%
7/11/97 2,798 lbs. Sulfuric acid
7/22/96 3,000 lbs. Sulfuric acid
8/11/96 100 gals. Sulfuric acid
6/12/96 13,263 lbs. Leach Solution (spent electrolyte)
3/23/96 3,000 lbs. Sulfuric acid
2/21/96 1,850 lbs. Leach Solution (spent electrolyte)
1/10/96 2,000 lbs. Sulfuric acid
1/8/96 4,000 lbs. Sulfuric acid
12/19/94 5,000 gals. Leach Solution
11/03/94 7,000 gals. Sulfuric acid
9/19/90 2,000 gals. Diesel fuel
3/16/90 1,500 gals. Hydrochloric acid
9/8/88 10 gals. PCB’s
For Documentation of Spills, See Hazardous Material Incidents--Sierrita
Summary of Spills at Badgad Copper Mine, Yavapai County, Arizona
The Hazardous Waste Incidents at Bagdad mine are of particular interest for a proposed mine that will need to truck in various chemicals and truck out copper concentrate to a smelter. These spills of extremely toxic chemicals and copper concentrate seriously impact the roadways and soils, as well as potentially pollute ground or surface water, on Forest Service, BLM and State Trust Land. Apparently, there was a winding road to the railroad junction, and eventually another route was used.
12/07/04 7,484 lbs. Leach Solution On-site (Report)
9/10/04 354 gals. Sulfuric Acid On-site (Report)
12/04/00 <200 gals. Sulfuric Acid State Trust
9/18/00 5,850 gals. Xanthate Federal
3/11/99 misc Cyanides, Acids Federal
3/07/99 12,000 gals. Effluent (treated ww) Federal
3/01/99 200 gals. Sulfuric Acid State
7/27/98 ? Sulfuric Acid State
1/01/98 50,000 lbs. Copper Concentrate State
12/12/97 40,000 lbs. Copper Concentrate State
9/17/97 7/7200 lbs. Sulfuric Acid On-site
6/11/97 50,000 lbs. Copper Concentrate Bagdad town
3/09/97 1,500 lbs. Sulfuric Acid On-site
7/18/96 3.57 lbs. Mercury Bagdad town
6/18/96 3/40,000 lbs. Copper Concentrate State/Private
8/31/95 35,000 lbs. Copper Concentrate State
7/21/95 48,100 lbs. Lead Sulfide/Cu Conc. County
11/22/94 2,100 gals. Diesel County
3/02/94 60 gals. Sulfuric Acid State
6/11/93 600 gals. Sulfuric Acid State
5/26/93 200 gals. Diesel Private prop
2/22/92 1,200 gals. Sulfuric Acid On-site
5/09/91 ? Sodium Cyanide State
9/18/90 13 gals. PCB On-site
12/17/87 1,500 gals. Sulfuric Acid State
11/09/87 2/2,500 gals. Sulfuric Acid State
9/20/86 50-60 gals. Sulfuric Acid State
For Documentation of Spills, See Hazardous Material Incidents--Bagdad
Spills at other facilities: Asarco
Silverbell
How Sulfuric Acid Spills Impacted Public Supply Water Wells
in Green Valley, Arizona
1) They did not occur on the same test date.
2) There was a gradual increase, a spike, then a decrease.
3) The increase was of sulfate but not of other common metals.
The sudden increases, then lowering of the levels, are not indicative of a traditional sulfate plume, or of a testing abnormality.
The problem in analyzing the data was finding the time frame that the sulfuric acid would flow from the spill in the mill/leach area to the public supply wells. I finally found the magic number!
It takes 39 months. Of six correlations available, four in a row were 39 months, then 24 months, then 21 months. It could be expected that with time the spills make a path to make the trip faster.
Date correlation of Sulfuric Acid Spills and Spikes in Sulfates
in Community Water Well #8
Spill Date Date of spike* Travel time to Well #8
± 2 miles11/12/94 First known spill
1/03/96 4/02/99 39 months
7/08/96 10/26/99 39 months
7/97 10/18/00 39 months
5/98 8/04/01 39 months
5/00 4/08/02 23 months
7/01 4/21/03 21 months
* These are approximate because Community Water was only testing semi-annually during part of this period.
Click here to go to Community Water Data